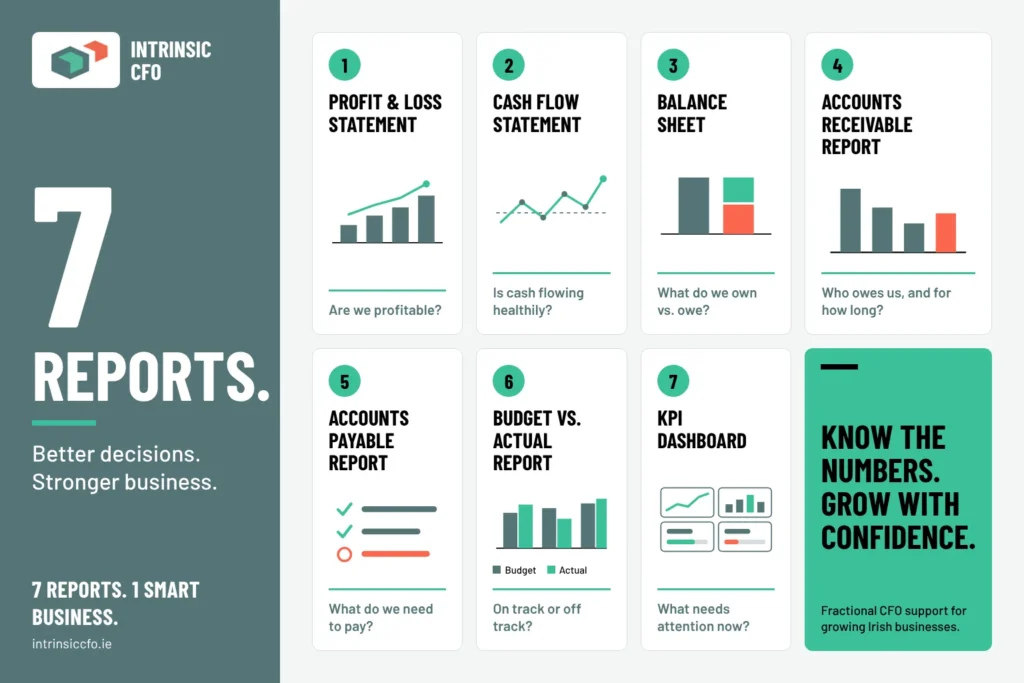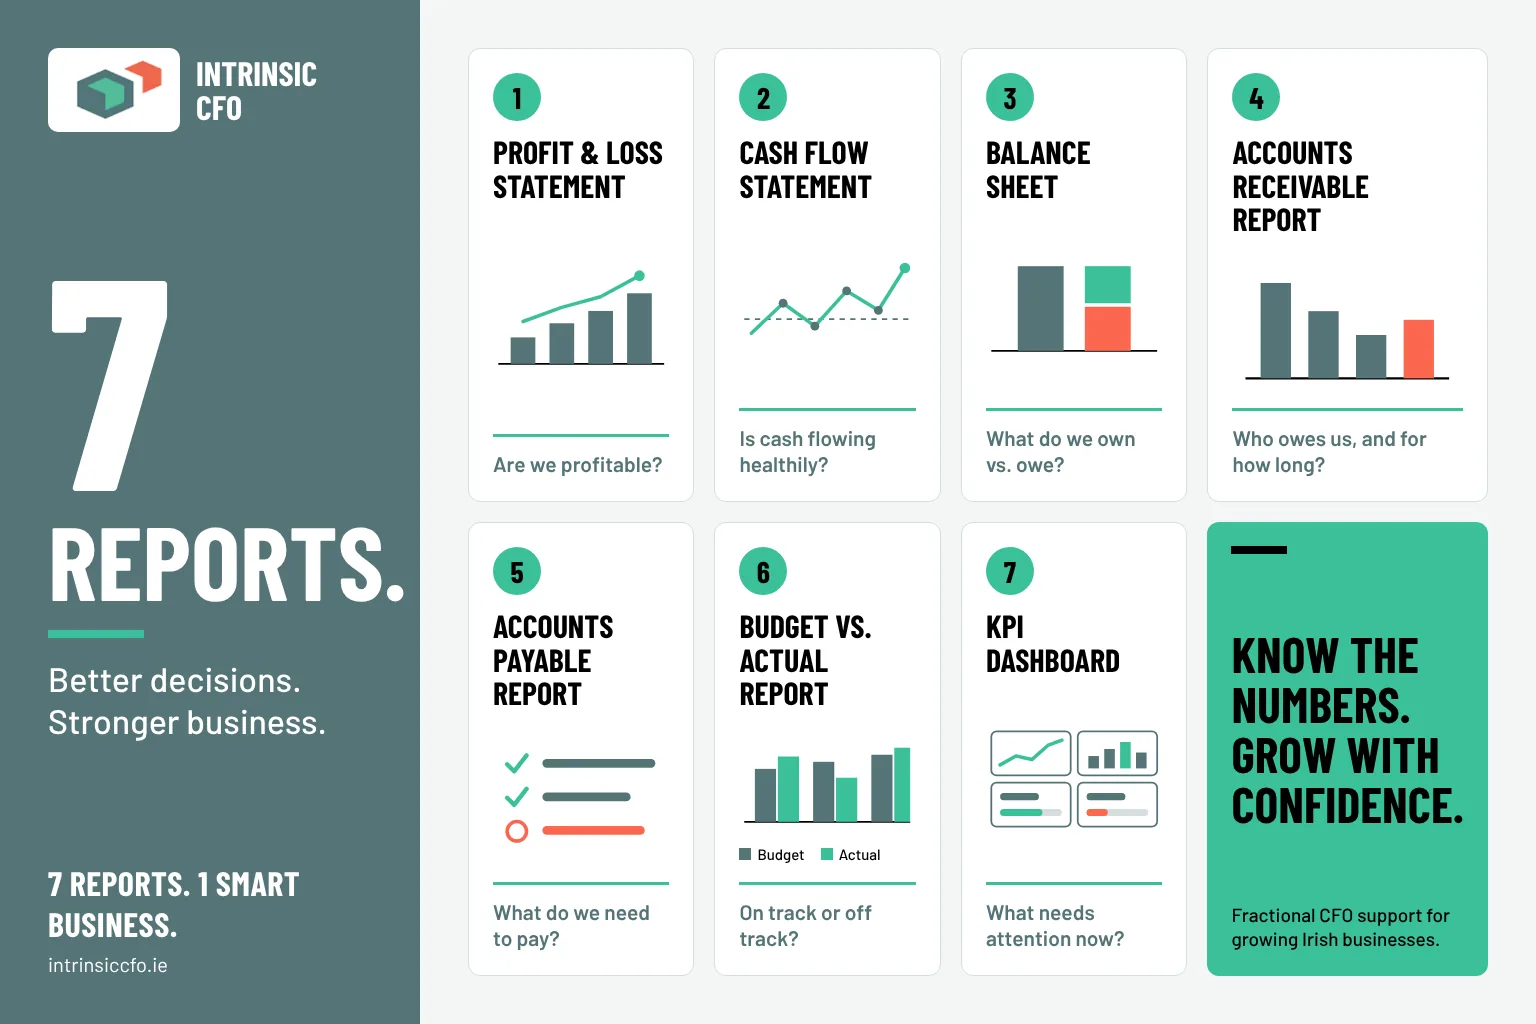
If you’re asking which monthly financial reports a small business owner should review, the answer is seven: the profit and loss statement, cash flow statement, balance sheet, aged receivables report, aged payables report, budget vs. actual report, and a KPI dashboard. Reviewed together, these seven reports give you a complete picture of profitability, liquidity, working capital and operating performance. For most small businesses, this core set provides the decision foundation every month. Add other reports as relevant to your specific business model.
Intrinsic CFO provides decision-ready financial reporting. By the end of this article, you’ll know what each report reveals, which metrics to check every month, and what to do immediately when a number looks wrong.
Key takeaways
- Seven reports, not one: Profitability, liquidity, working capital and operating performance each require a different lens to see clearly.
- Sequence matters: Start with the three financial statements, then the working capital reports, then the diagnostic layer.
- Trend beats snapshot: A metric moving in the wrong direction for three consecutive months is a stronger signal than one bad number in isolation, though the right threshold will vary by metric and your business’s seasonality.
- Act early on cash: Addressing a shortfall at month one is far less painful than acting at month four.
- Benchmarks are directional: Compare your numbers to your own prior periods first, then use sector ranges for context.
- Consistency compounds: The same review process, every month, builds the financial clarity most growing businesses lack.
Why most owners read their financials too late
The difference between data and a decision-ready report. Most small businesses receive their financials weeks after month-end, often as a raw dump of numbers with no narrative or context. By the time you read the P&L, the problem it describes is already a month older. A structured monthly review changes that dynamic: reports run within the first five to seven business days after month-close, reviewed in a defined sequence, with clear trigger points for action rather than passive observation. Targeting that early window is best practice. The sooner the books close, the sooner you can act.
Why one report on its own can mislead you. A P&L can show healthy profit while the business quietly runs out of cash. A balance sheet can look solid while receivables age past 90 days uncollected. No single report tells the full story, which is why the seven reports work as a system. Each one checks what the others can miss, and together they replace instinct with a complete, fact-based view of the business. It is the same gap I see in companies that have grown but don’t know why.
What financial reports should a small business owner review monthly?
Every structured monthly review starts in the same place: the three core financial statements. They establish the baseline for everything that follows. Then come the two working capital reports, and finally the two diagnostic reports. In order:
- Profit and loss statement
- Cash flow statement
- Balance sheet
- Aged receivables report
- Aged payables report
- Budget vs. actual report
- KPI dashboard
1. Profit and loss statement: reading beyond the bottom line
The P&L shows revenue, cost of goods sold, gross profit, operating expenses and net profit for the month. On every review, check five things: revenue vs. prior month and budget, gross margin trend, operating expense totals (especially payroll and overheads), EBITDA or operating profit, and net profit margin. A healthy top line can hide a deteriorating margin if costs are creeping up faster than sales, so never stop at the revenue line.
2. Cash flow statement: why profit doesn’t equal cash
The cash flow statement has three sections: operating activities, investing activities and financing activities. Cash from operations is the most important line for a small business because it shows whether the core business generates actual cash, not just accounting profit. Check operating cash flow vs. net profit (large gaps often signal receivables or inventory issues), free cash flow (operating cash minus capital expenditure), and whether the ending cash balance matches your bank reconciliation. You’ll find more on this in my Budgeting & Cash Flow articles.
3. Balance sheet: the month-end health check
The balance sheet is a snapshot of what the business owns, what it owes, and what remains for the owner at a single point in time. Check the cash balance (reconciled to the bank), receivables growth relative to revenue growth, payables and short-term debt as a signal of upcoming cash pressure, and working capital (current assets minus current liabilities). A deteriorating current ratio is often the earliest structural warning a business gets. Catch it here, before a cash problem becomes a crisis.
4. Aged receivables: who owes you and how long they’ve been sitting on it
The aged receivables report shows every outstanding customer invoice sorted into ageing buckets: current, 1–30 days past due, 31–60, 61–90, and 90+ days. Check the total overdue balance as a percentage of total receivables, the concentration in the 60+ day buckets, the top five overdue customers by value, and your days sales outstanding (DSO) relative to your payment terms. Invoices ageing past 90 days generally carry a high risk of becoming uncollectible and may require a bad debt provision before the auditors ask for one.
5. Aged payables: managing what you owe before it manages you
The aged payables report shows outstanding supplier bills by age and due date. Check total payables vs. prior month, any payables already past due (a direct signal of cash stress), the largest supplier balances and their due dates, and days payable outstanding (DPO) vs. the terms you agreed. Extending payables preserves cash, but it has to be weighed against protecting key supplier relationships. Missing payments without communication tends to cause more damage than a brief delay discussed openly and in advance.
6. Budget vs. actual: where the plan meets reality
This report is the diagnostic layer on top of the P&L. It answers not just “what happened” but “why it differs from what we planned.” Check revenue variance broken down by volume and price, gross margin variance (was it pricing, cost or product mix?), payroll and headcount variance, and the updated year-end forecast based on actual performance to date. The goal is not to chase every small variance. Focus on the three to five largest deviations, assign an owner and a deadline to each, and move on.
A budget vs. actual report is only as good as the budget behind it. If yours is due a refresh, read how to build a budget that stands up to challenge and how to use budget season to strategically cut costs.
7. KPI dashboard: the one-page view
A KPI dashboard should contain five to eight business-critical indicators, not every metric your accounting software can produce. It should include:
- Revenue vs. plan (month-to-date and year-to-date)
- Gross margin and net margin
- Cash position and runway in months
- DSO and overdue receivables percentage
- Payroll as a percentage of revenue
- One operational driver specific to your business (utilisation rate, average transaction value, billable hours or similar)
It should tell you at a glance whether the business is on track and, if it isn’t, point you directly to which of the other six reports to open next. Building management reporting and KPIs that owners actually use is a core part of how I help businesses grow.
What the benchmarks actually mean for your sector
Benchmarks are directional, not universal targets. The most useful comparison is always your own prior periods, because that’s the trend you control. That said, sector ranges help you understand whether your numbers are structurally in the right territory. The table below summarises common reference ranges by industry:
| Sector | Gross margin | Net margin | Current ratio | A/R days (DSO) |
|---|---|---|---|---|
| Professional services | 50–75% | 10–25% | 1.3–2.0 | 25–50 days |
| Manufacturing | 25–40% | 5–10% | 1.5–2.2 | 35–55 days |
| Retail and e-commerce | 20–40% | 2–6% | 1.2–1.8 | 4–15 days |
| Wholesale and distribution | 18–30% | 2–6% | 1.2–1.8 | 30–55 days |
| Construction and engineering | 15–30% | 1–6% | 1.5–2.5 | 45–75 days |
| SaaS and technology | 60–90% | 10–25% | 1.5–2.0 | 35–60 days |
| Restaurants and food service | 55–70% | 3–9% | 1.0–1.5 | 0–10 days |
| Healthcare practices | 45–70% | 5–15% | 1.8–3.0 | 35–60 days |
These ranges are reference points. Verify them against your own industry sources and treat them as a starting framework rather than fixed standards. Apply the principle of “trend over target” across all seven reports. A metric moving in the wrong direction for three consecutive months is a meaningful signal, even if it hasn’t crossed a benchmark threshold yet. A 45-day DSO against net 15 payment terms is a serious problem regardless of what the sector average says, because the gap represents cash the business has earned but not collected.
What to do when a report flags a problem
When the cash flow statement shows a shortfall or the bank balance is trending down, act in sequence:
- Verify the shortfall. Reconcile the bank account and confirm upcoming payroll, taxes, supplier bills and loan payments.
- Calculate your runway. Available cash divided by average monthly cash burn.
- Build a 13-week rolling cash forecast using conservative sales estimates and realistic collection dates. Cash flow forecasting is where most recovery plans start.
- Accelerate collections on overdue invoices immediately.
- Freeze discretionary spending and protect payroll and tax obligations above everything else.
Acting at month one of a downward trend is significantly less damaging than acting at month four, when options are narrower and relationships are strained.
Your monthly financial review checklist
Close your books within the first week of each month. Then run and review all seven reports in this order: P&L, cash flow statement, balance sheet, aged receivables, aged payables, budget vs. actual, KPI dashboard. Flag the three to five largest exceptions, assign an owner and a deadline to each, and set the next review before you close the file.
This order matters: the financial statements set the baseline, the working capital reports reveal timing risk, and the final two confirm whether the business is executing its plan. The same process, every month, builds the financial muscle memory that most growing businesses lack.
Seven reports, one clear picture of your business
Knowing what financial reports a small business owner should review monthly is only the first step. Consistency is what makes the process pay off. Seven reports, reviewed in sequence every month, give you a complete and actionable picture of financial health. None of them requires a finance degree to read. They require a defined process and the discipline to act on what they show.
For owners who want this done for them, that’s exactly what Intrinsic CFO delivers. As a fractional CFO, I bring senior financial leadership to owner-managed businesses that need CFO-level thinking without the cost of a full-time hire. It’s one of the main reasons companies in Ireland hire fractional CFOs.
Want a monthly reporting pack built for your business?
If running a monthly financial review feels like more than your current setup can support, the answer isn’t to skip it. It’s to get the right support in place. Have a look at how I work with growing businesses, or get in touch to book a free first call about what a structured monthly reporting pack could look like for your business.
Frequently asked questions
How quickly should we run and review these seven reports after month-end?
Run and review the reports within the first five to seven business days after month-close, which means closing your books within the first week of each month. The sooner the books close, the sooner you can act on issues rather than reacting to stale data.
When should we close our books each month to run the structured review?
Close your books within the first week of each month so the reports can be run in the first five to seven business days after month-close. That early window gives you time to verify the numbers and act before problems are a month old.
How do we calculate runway when cash is tight?
Runway is available cash divided by average monthly cash burn. It tells you how many months of operations you can cover with current cash. Use that figure to prioritise verification steps and build a short-term cash forecast for the coming weeks.
What should be on a one-page KPI dashboard so it points us to the right report quickly?
A one-page KPI dashboard should include five to eight critical indicators: revenue vs. plan (MTD and YTD), gross and net margin, cash position and runway in months, DSO and overdue receivables percentage, payroll as a percentage of revenue, and one operational driver specific to your business. That compact set should tell you at a glance whether to open one of the other six reports for more detail.
How should we use sector benchmarks when reviewing our metrics?
Use sector benchmarks as directional reference points, but compare your numbers to your own prior periods first, because trend is the metric you control. Treat the ranges as a starting framework and treat three consecutive months of movement in the wrong direction as a meaningful signal, even before a benchmark is crossed.
Have a question that isn’t covered here? See the Intrinsic CFO FAQs.